
Astrophotography System Comparsion Tool
March 24, 2026
Viewing note
This builder is usable on smaller screens, but the full layout is easiest to view and work with on a desktop or laptop display.
Table of Contents Show (Click on lines to navigate)
Introduction
Planning an astrophotography upgrade?
Wondering whether a new camera or filter set will actually make a difference?
This often comes down to guesswork. This tool replaces that guesswork with physics. Enter two imaging systems (cameras, filters, focal ratio, sky conditions), and it computes a quantitative signal ratio: how many hours on System B are equivalent to one hour on System A, accounting for quantum efficiency, read noise, sky background, and optical throughput. Both broadband (LRGB/OSC) and narrowband (Ha/OIII/SII, dual-band) modes are supported. The underlying model and all assumptions are documented in the Technical Appendix tab.
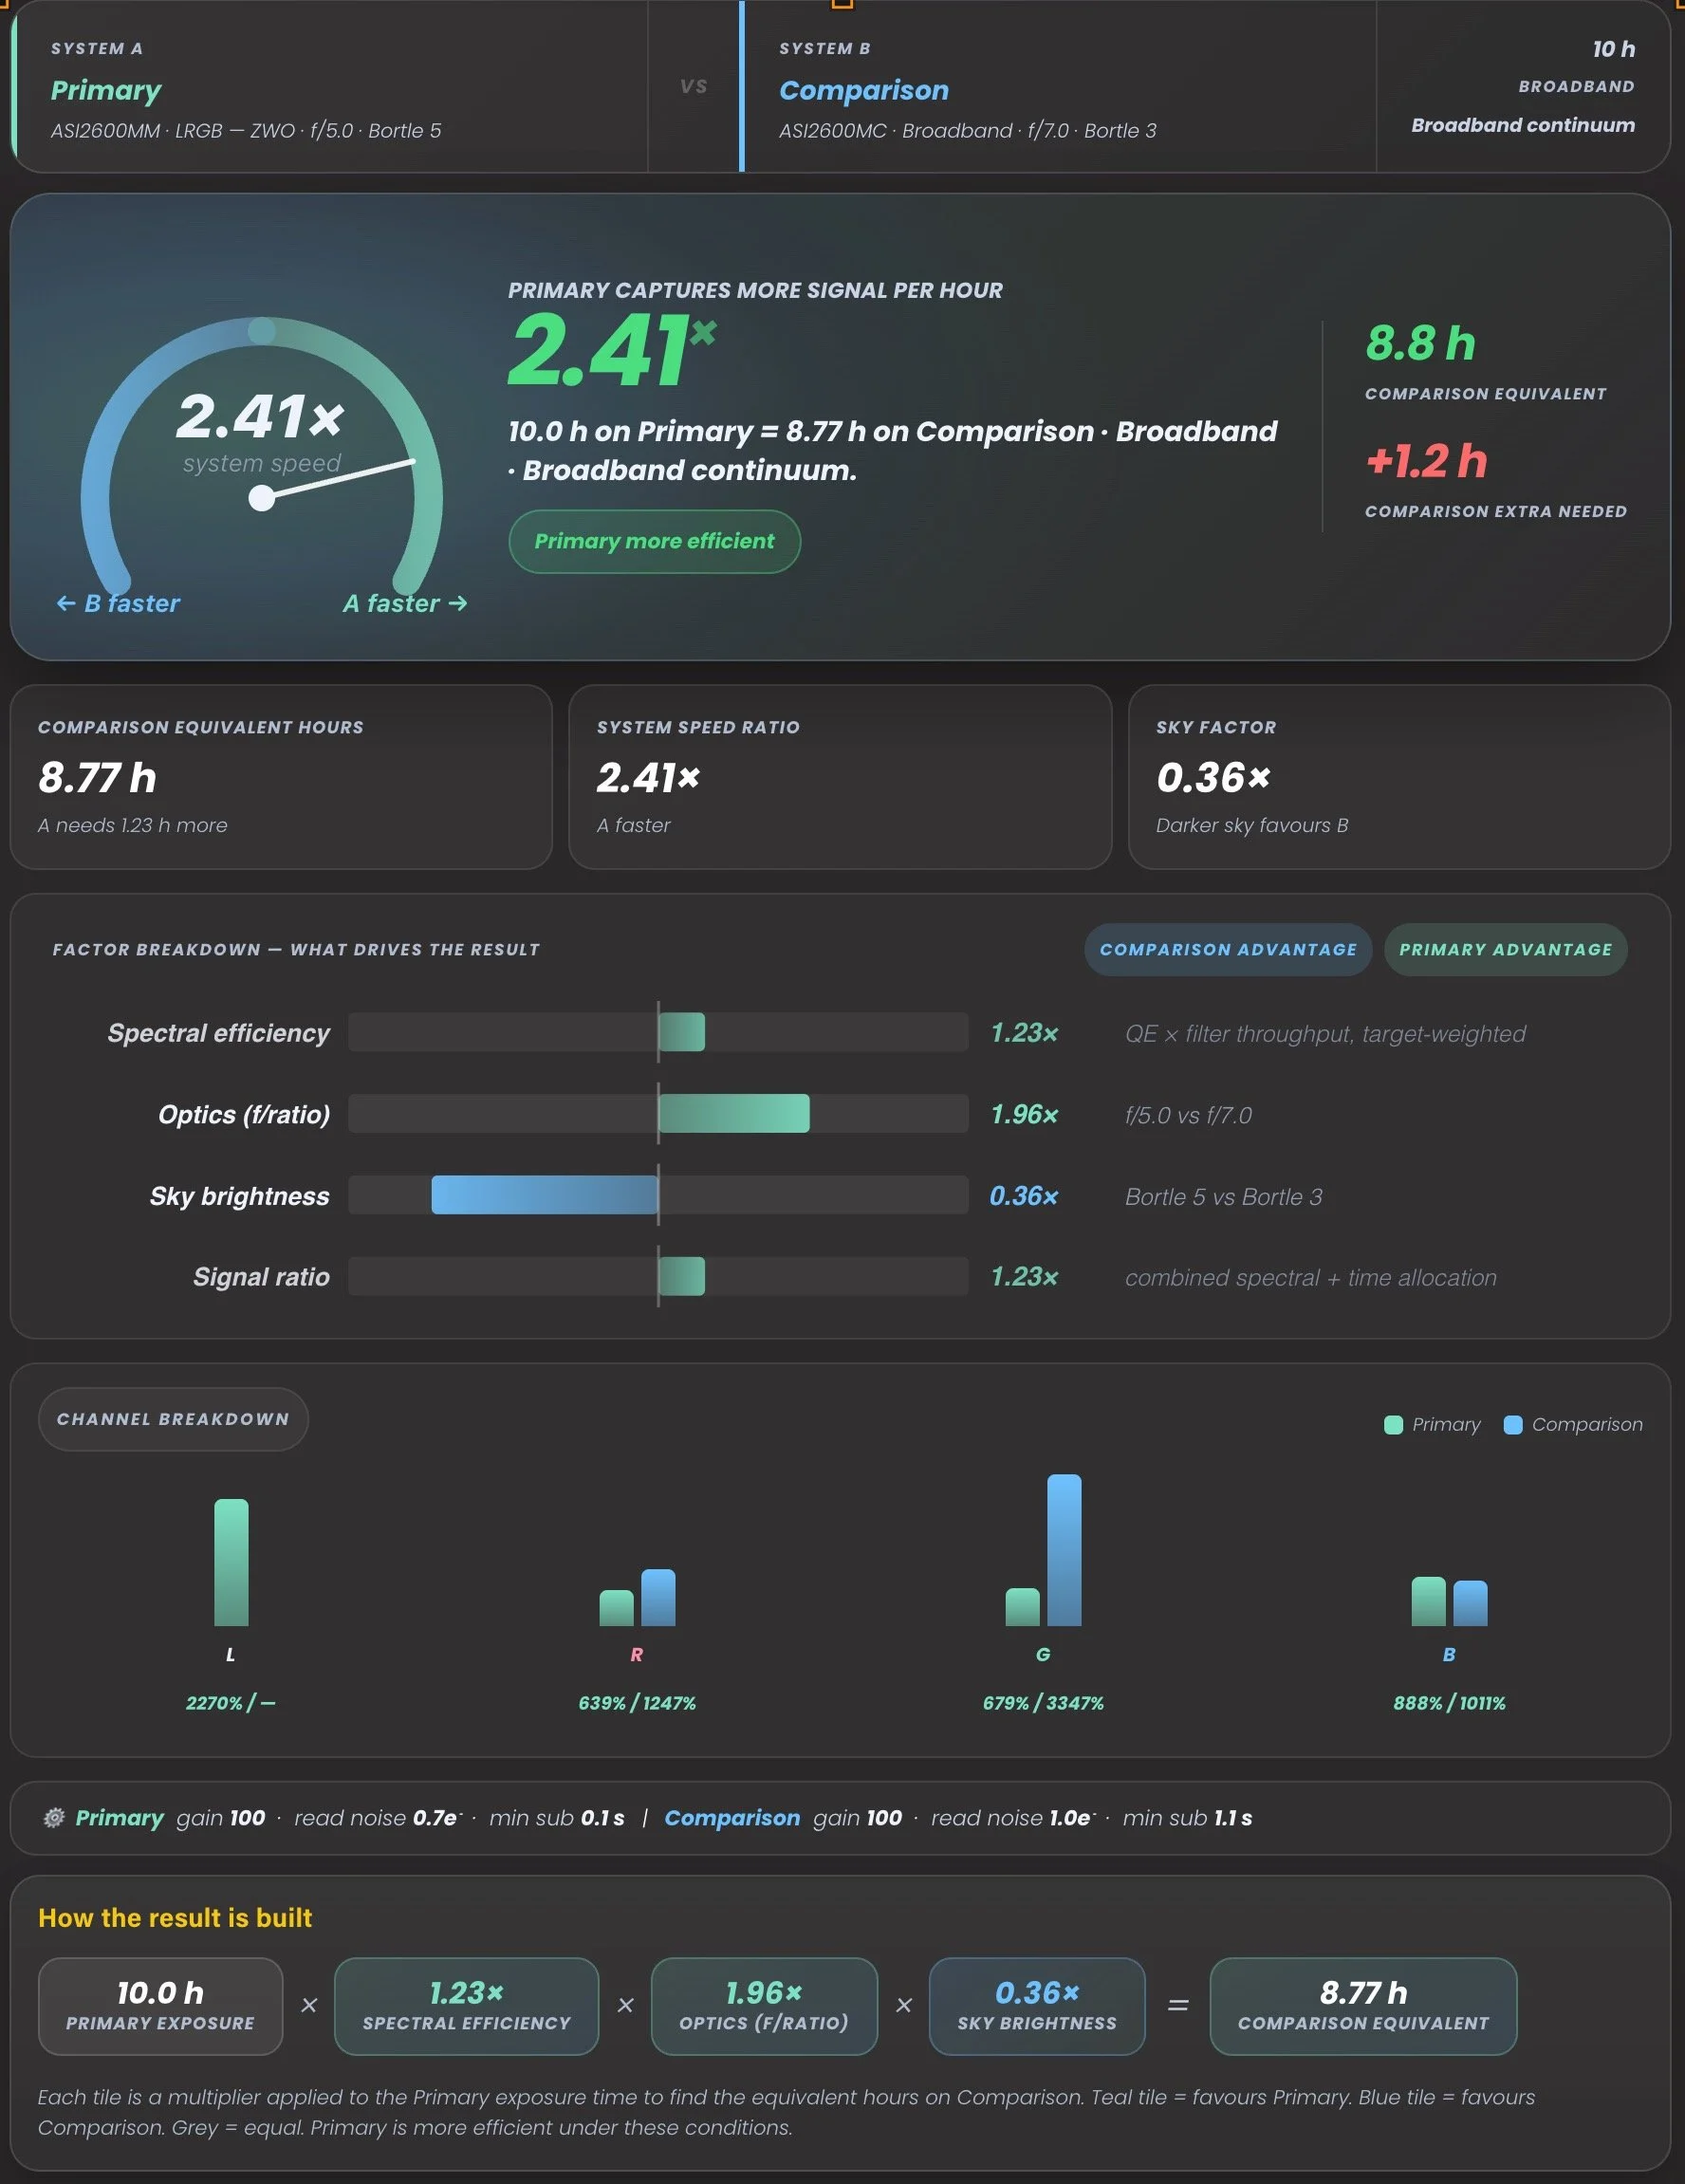
Astrophotography System-to-System Comparison Tool
How the result is built
Scenario heatmap — hours B needs to match A
Narrowband filter audit
Channel / filter contribution table
Validation lab
Data provenance & import audit
Advanced debug
How to use the tool
1. Choose a mode. Select Broadband for LRGB or OSC galaxy and nebula work, or Narrowband for emission-line imaging with Ha, OIII, and SII filters. The tool adjusts its model, available filter sets, and output panels accordingly.
2. Configure System A and System B. Each system has a camera, focal ratio, Bortle-scale sky darkness, and a filter set. System A is typically your current or reference setup; System B is the one you're evaluating. Use the example buttons to load a representative starting configuration.
3. Read the result. The headline number is the equivalent hours figure — how many hours on System B yield the same collected signal as your chosen total on System A. A value below 10 h (when System A is set to 10 h) means System B is less efficient; above 10 h means it's more efficient. The signal ratio, sky factor, and optics factor panels break down exactly where the difference comes from.
4. Dig into the details. The QE chart overlays sensor quantum efficiency curves for both cameras. The Filter response chart shows passband transmission. The Channel heatmap compares per-channel contributions. In narrowband mode, the Narrowband audit panel adds FWHM, peak transmission, and per-line SNR terms for each filter.
5. Check the Technical Appendix. The Appendix tab contains the full mathematical derivation, all model assumptions, and the data provenance for every camera and filter set. If a result looks surprising, the appendix is the right place to audit it.
6. Validation Lab. The Audit tab runs a built-in test suite — curated sanity cases and a generated comparison matrix across all cameras — and flags any result that falls outside expected bounds. This is primarily a data-integrity check, but it's also a useful way to explore how different equipment combinations rank against each other.
Feedback and Suggestions
Any feedback or suggestions you might have for improving the tool can be sent here: Contact@CosgrovesCosmos.com